Activity
Watch CPU, memory, disk, network, and energy use on your Mac process by process from the browser, and quit or force quit anything that misbehaves.
Activity is a live process monitor for the Mac. It shows what the machine is busy with, process by process, and lets an admin stop one. The daemon samples only while the page is open, so a closed Activity page costs nothing.
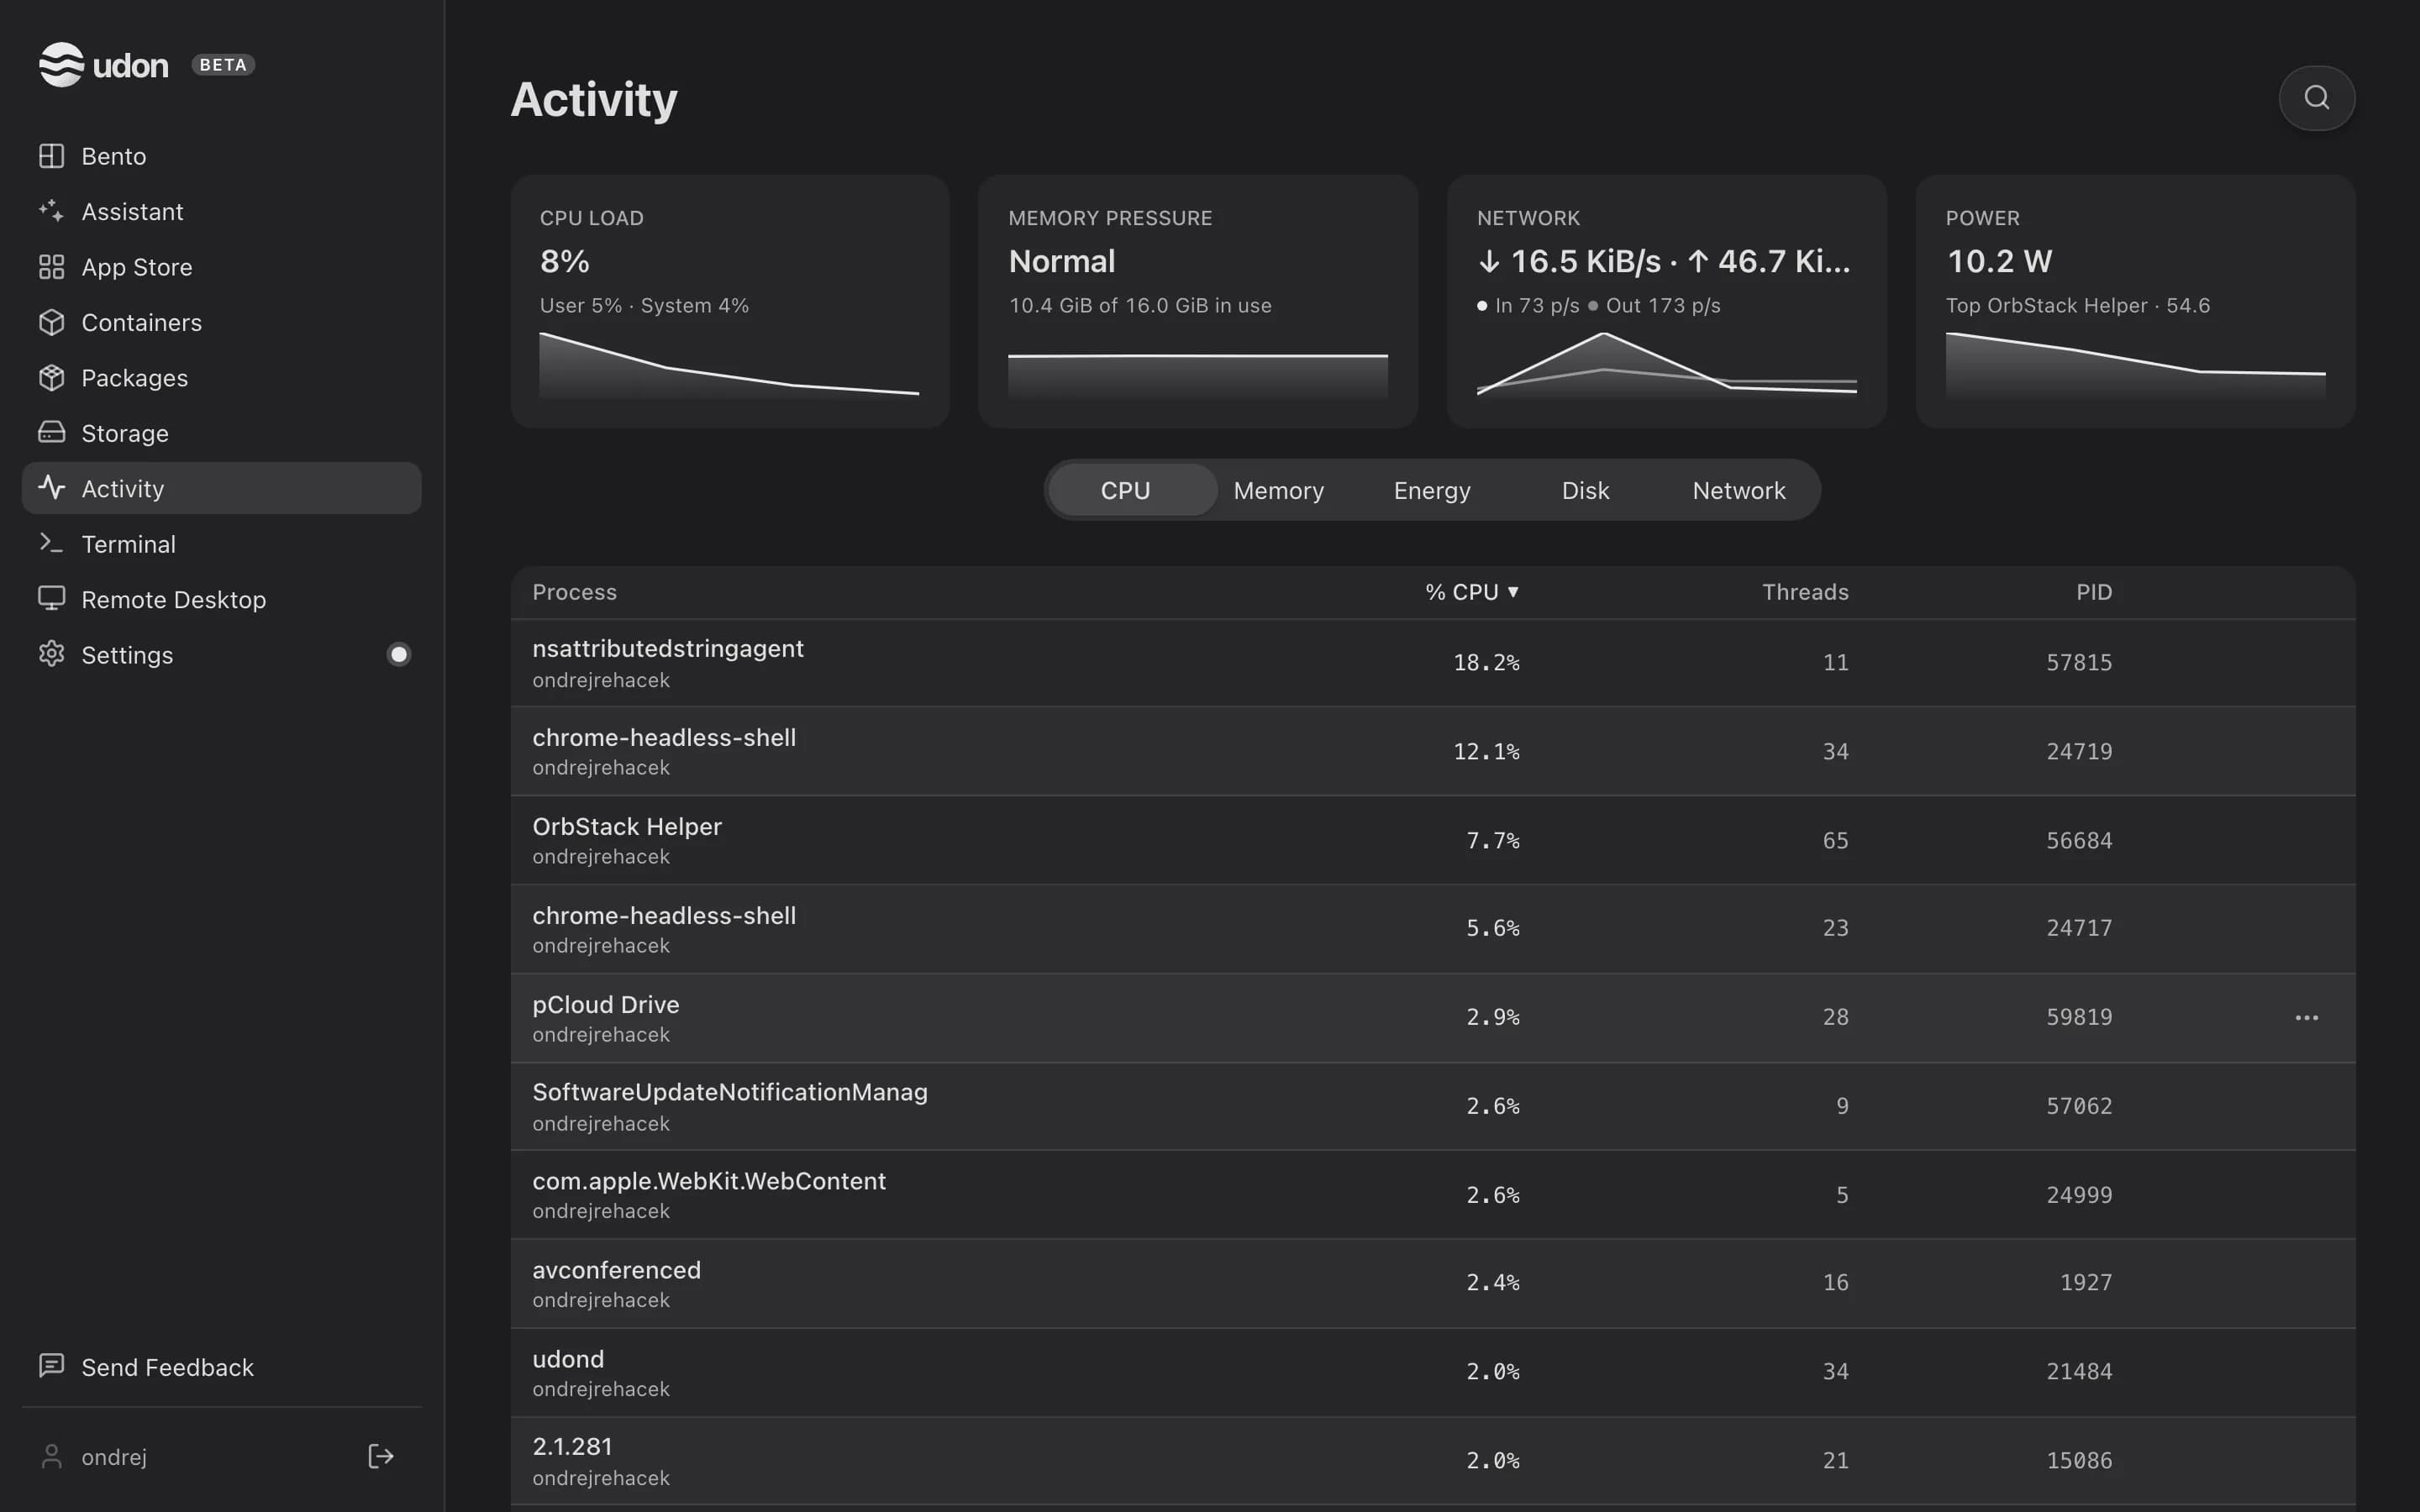
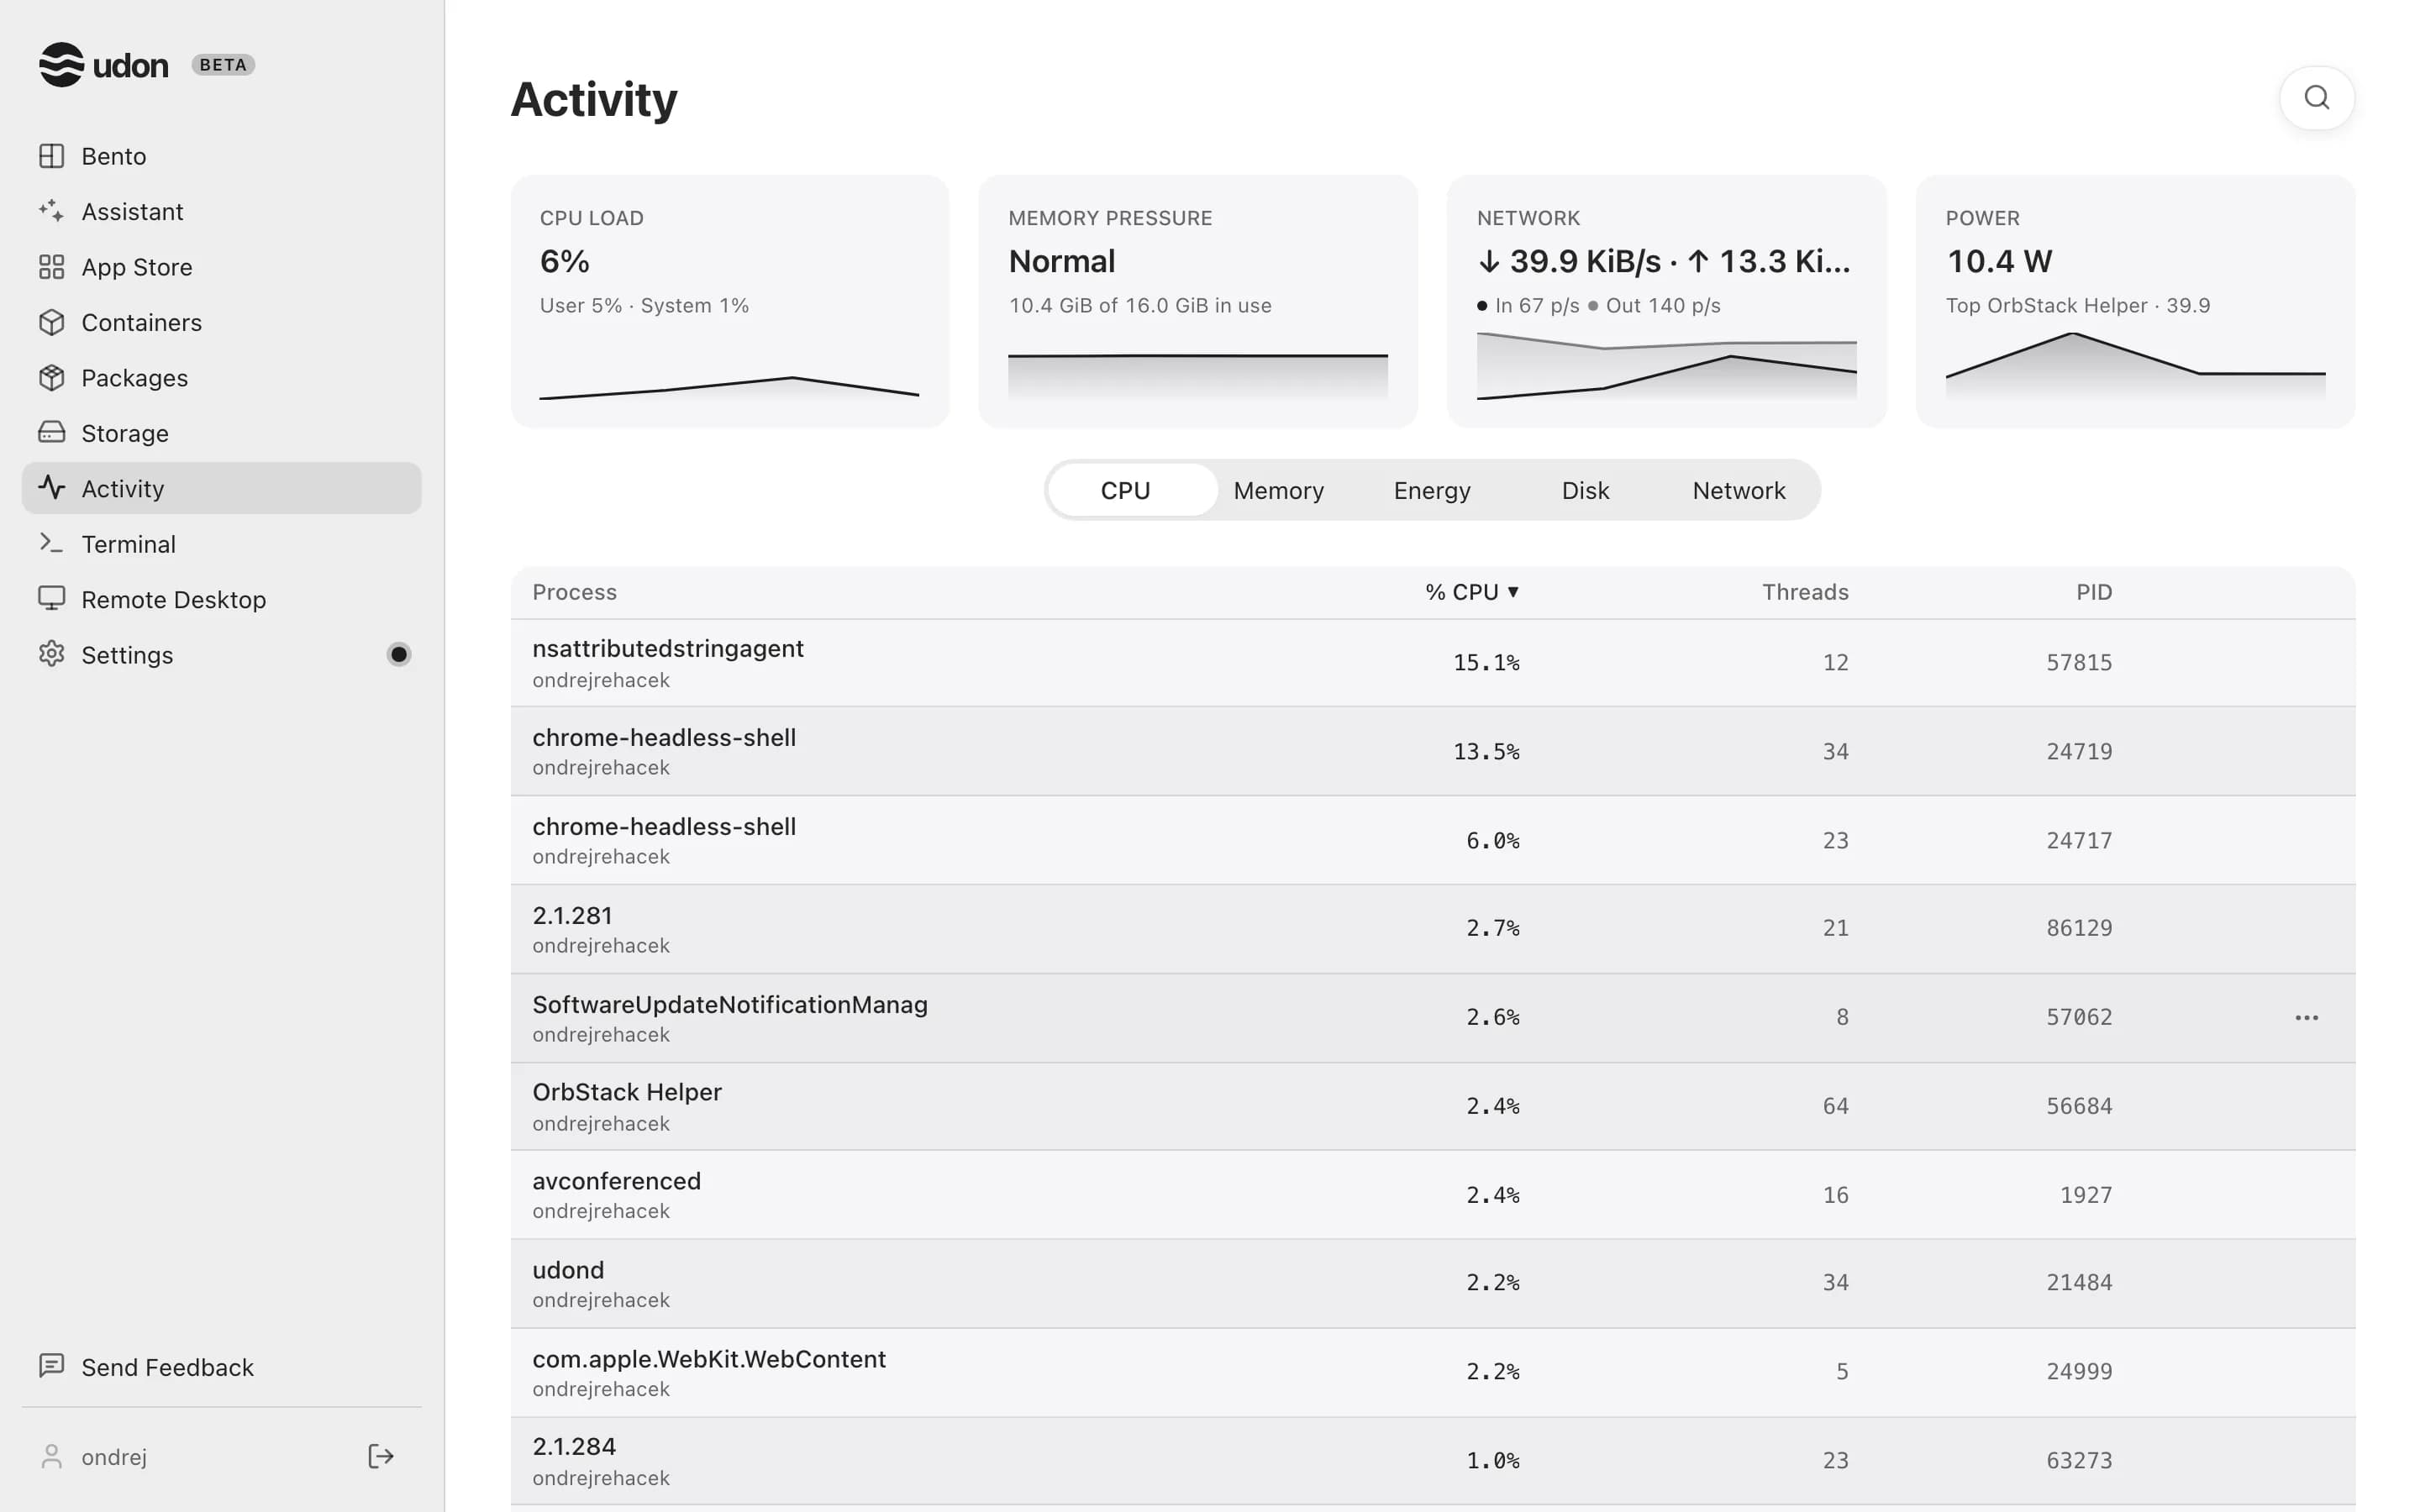
The tiles
Four tiles run across the top, each with a trend line for the last two minutes. Hover or focus one for its breakdown:
| Tile | Shows | Hover for |
|---|---|---|
| CPU load | Total usage, split into user and system | Load average and core count |
| Memory pressure | Normal, Warning, or Critical, with memory in use | Total, used, compressed, and swap |
| Network | Receive and send rates | Byte rates and packet rates |
| Power | Watts drawn now, and the top process | The three processes with the most energy impact |
On a phone, only the tile for the open tab shows, and the Disk tab gets a Disk activity tile.
The process list
Five tabs sit under the tiles. Each lists the same processes with columns for its resource:
| Tab | Columns | Sorted by |
|---|---|---|
| CPU | % CPU, Threads | % CPU |
| Memory | Memory, Threads | Memory |
| Energy | Energy impact, Wakeups/s | Energy impact |
| Disk | Written/s, Read/s | Written/s |
| Network | Sent/s, Received/s | Sent/s |
Every tab also shows the process name, the user that owns it, and the PID. Click a column heading to sort; each tab keeps its own sort for the rest of the browser session. The search button in the toolbar filters by name or PID, separately on each tab. The list shows 50 processes a page and refreshes every two seconds.
Per-process network rates come from nettop, which Udon runs only while the Network tab is open.
A process it can't match shows a dash instead of a zero, so an unmeasured process never looks
idle.
Energy impact is an estimate built from processor time and idle wakeups. The watts on the Power tile are a real reading from the Mac's sensors.
Stop a process
Hover a row and open its three-dot Actions menu:
- Quit asks the process to shut down, so it can save and close.
- Force quit stops it at once. Unsaved work is lost.
Both ask first, naming the process and its PID. Stopping a process needs an admin account and is recorded in the audit log; for other roles both items are greyed out. On a phone, tap a process to see all its readings; admins get Quit and Force quit there too.
What you can see
Activity needs an operator or admin account. Udon runs as your user, so it leaves out root-owned system processes rather than showing them with blank readings. Processes that exit mid-sample are skipped, so the count moves a little between refreshes. Rates are measured between two samples, so the first list after the daemon starts shows zeros for them.
The Processor, System, Network, and Power tiles on the dashboard open Activity on the CPU, Memory, Network, and Energy tabs.
Workflows
Run synced workflows for Udon's AI assistant, write local ones with instructions, reference files, and scripts, import a SKILL.md, and export a ZIP.
Monitoring
See live CPU, memory, network, power, and disk use for your Mac on the dashboard, and check that Udon's permissions and container engine are healthy.