Monitoring
See live CPU, memory, network, power, and disk use for your Mac on the dashboard, and check that Udon's permissions and container engine are healthy.
The dashboard shows the Mac's live CPU, memory, network, power, and disk use on tiles that update while the page is open. Click a tile to open the page behind it, such as Activity for the same numbers process by process.
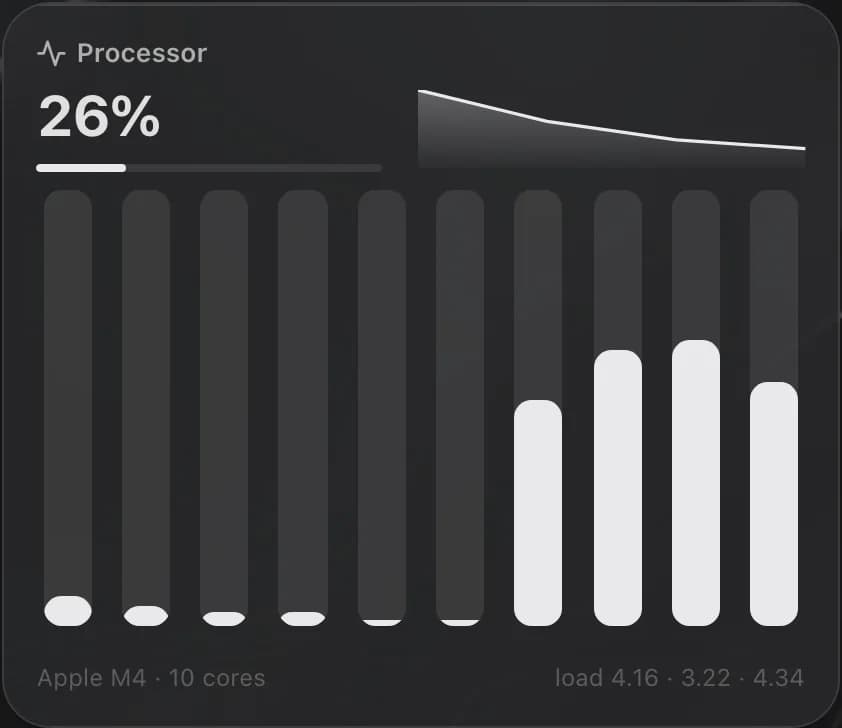
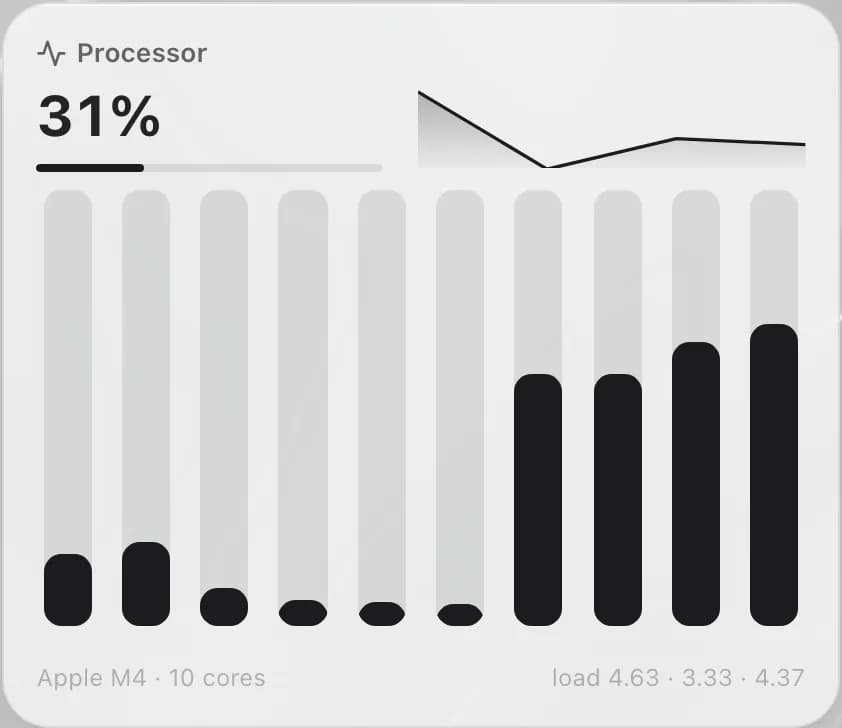
Dashboard tiles
A new dashboard starts with six tiles: Processor (at its largest size), System, Containers, Network, Power, and Disks. Each comes in three sizes, and you resize, move, or remove them like any other tile. Shares, Homebrew, and Tailscale wait in the Tile Library.
| Tile | Small | Larger sizes add | Opens |
|---|---|---|---|
| Processor | Total CPU use and the 1-minute load average | A trend line, then a bar per core with the chip and core count | Activity, CPU |
| System | Memory in use, of total | A memory ring, uptime, and load, then hostname, model, chip, and macOS version | Activity, Memory |
| Network | Download and upload rates with a trend line | The primary IP, then up to five interfaces and the gateway | Activity, Network |
| Power | Watts drawn now, or the battery charge on a laptop, and a heat warning when the Mac runs warm | A trend line, the power source, UPS charge, then time remaining and battery health | Activity, Energy |
| Disks | Percent of the boot volume used | Internal disks, then every disk, each as a used-of-total bar | Storage |
| Containers | Running of total, and "all running" or "N stopped" | A grid of your containers with state dots; click a running app to open it | Containers |
Trend lines cover the last three minutes. Sizes use binary units (1 KiB = 1024 bytes), so they read a little lower than the decimal figures macOS shows.
Health
Settings → Health checks what Udon depends on, in two cards:
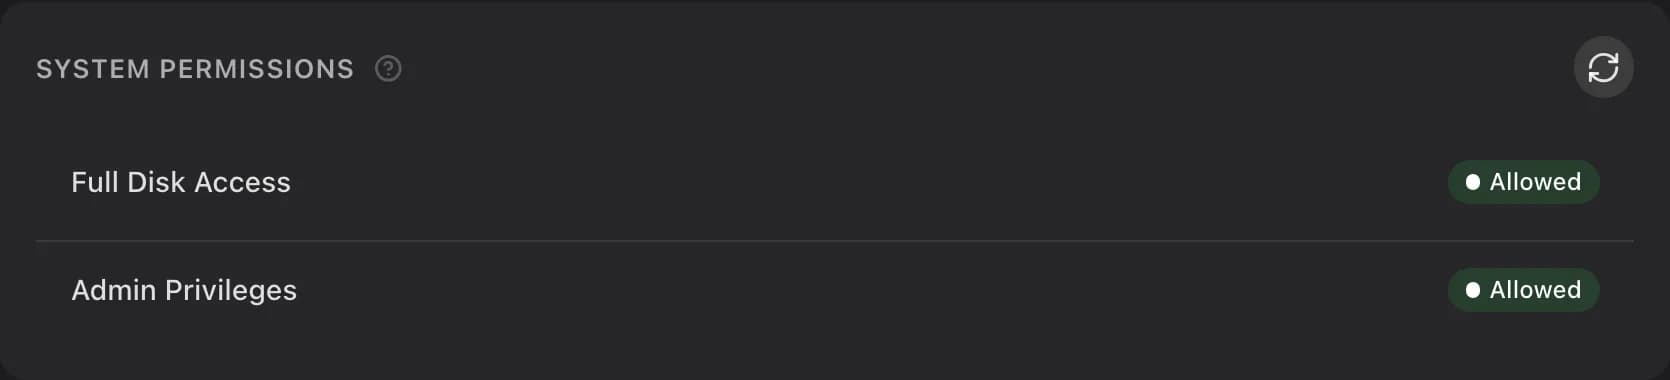
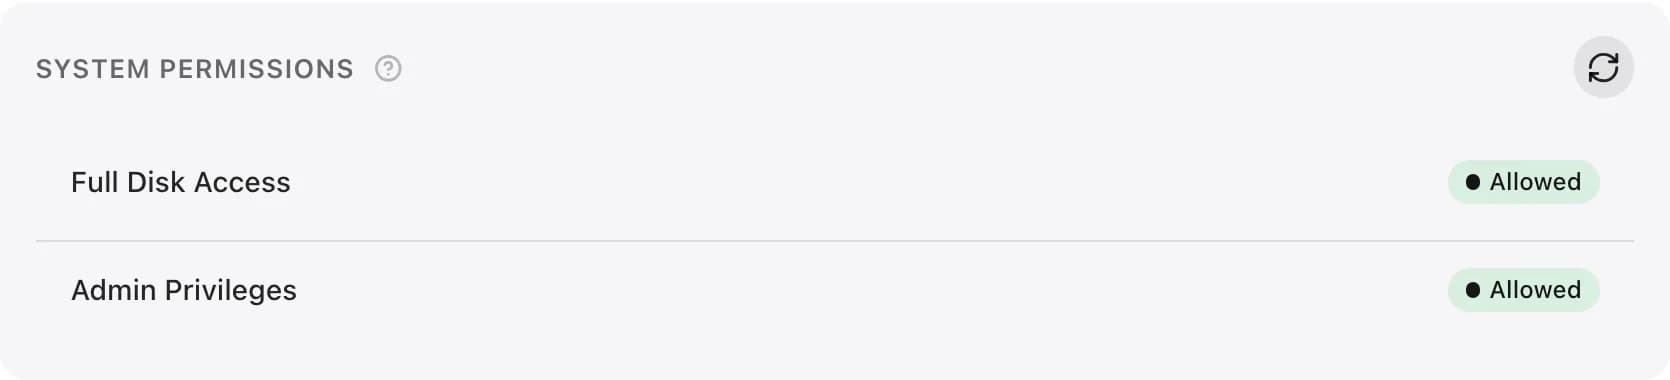
- System Permissions: Full Disk Access and Admin Privileges, each Allowed or Denied. Udon needs both; until they're granted, the dashboard shows a full-screen prompt instead of its pages. Grant them from the menu bar app.
- Services: the version of your container engine (Apple Container or OrbStack) and of Homebrew. A missing or failing service shows Not installed or Unavailable; hover it for the daemon's message. When a newer version exists, an Update chip appears beside the version. For Homebrew it runs the update in the same live terminal the Packages page uses. The container engine installs separately from Udon, so its chip opens a dialog with a link to the release.
Service results are cached for 60 seconds. An admin can check again at once with the circular-arrow button (Recheck) on the System Permissions card.
Full Disk Access is checked at startup and every 10 seconds while macOS refuses it. A grant, or a check that couldn't verify access either way, is kept until restart or a manual Recheck. Background service health checks continue without reopening protected files. Use Recheck after changing the Full Disk Access switch in macOS. If a permission screen replaces the dashboard, its button is Check again. The menu bar's Permissions refresh also checks both processes. See Verify Full Disk Access if Udon still reports missing access.
A failing check, such as a stopped container engine, puts a red dot on Settings in the sidebar. A missing Homebrew doesn't, since only the Packages page needs it. Waiting updates get an accent dot instead; see Attention dots.